Weekend 19th / 20th December 2015
It was a good start to the week but unfortunately I didn’t manage to keep that momentum going and was getting a little sloppy towards the end of the week. The points tally was positive which I guess was the main thing.
So what made it a tough week? On Monday we had some heavy buying during the out-of-hours Asian session, but once the market opened it headed back down quite sharply. I think I got short trading the MATD (morning after trend day) and had a good read on the market up to then…
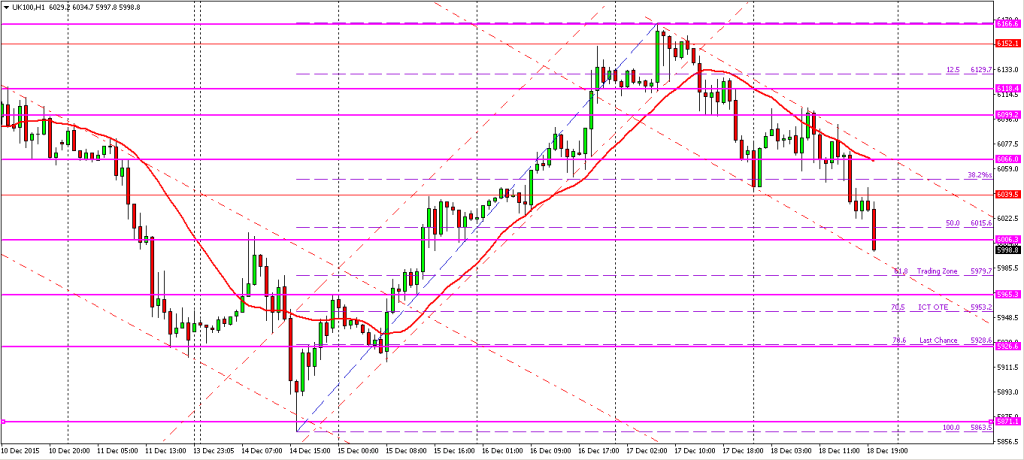
The FTSE 100 index reversed later that afternoon and really took off from there, recovering over 300 points from Monday’s low, trading within the upwards trending channel until Thursday afternoon. Think I was a little surprised with the strength of the pullback given the rest of the news (e.g. the FED planning to raise interest rates), and couldn’t bring myself to really get totally in sync with the market this week.
Looking back at the chart now it would have been good to hold a portion of my trades for over a day or two. Additionally there were several good opportunities to add to longs during the course of the week, especially as price fell back to the lower trendline along the channel or the 20-period moving average.
I’ve also marked out Fibonacci extensions on the chart and as you can see the marked has fallen through the 50% retracement level. In hindsight I was expecting the 38.2% level to hold on Friday; partially why I took that counter-trend trade which unfortunately lost me 20 points. Will be interesting to see if the FTSE makes it down to the 70.5% level (ICT OTE), as that will be an ideal area to get long. Watch out for that 5950 level … remember, you heard it here first!!
Also noticed that my charts are getting really messy by the end of the week with too many levels which can get confusing at times. Normally I start off marking my charts over the weekend and mark up the key levels on the daily and hourly charts in pink (bold line). I then go down to the 15 and 5 minute charts to draw in the intraday support levels plus the high and low of the previous day in red (thin line). On Monday morning my charts look relatively clean, however, during the course of the week more intraday support and resistance levels are defined and added so by Friday the 5 minute chart gets a little noisy!
Only one more week to go before Christmas … Perhaps we may have a Santa rally the week after and close out 2015 with a bang! Have a great weekend!

