Going into this mornings session the following points were evident:
- The FTSE had finally posted a green candle on the daily chart after several consecutive red ones.
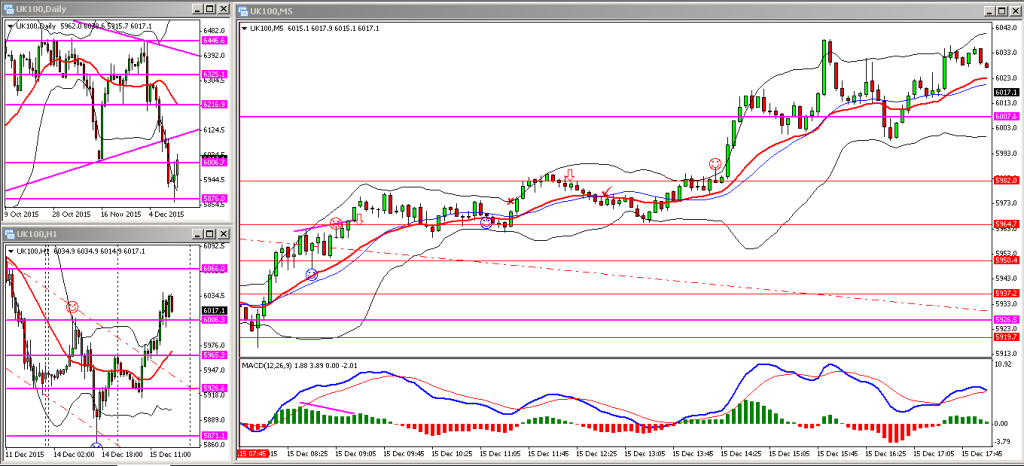
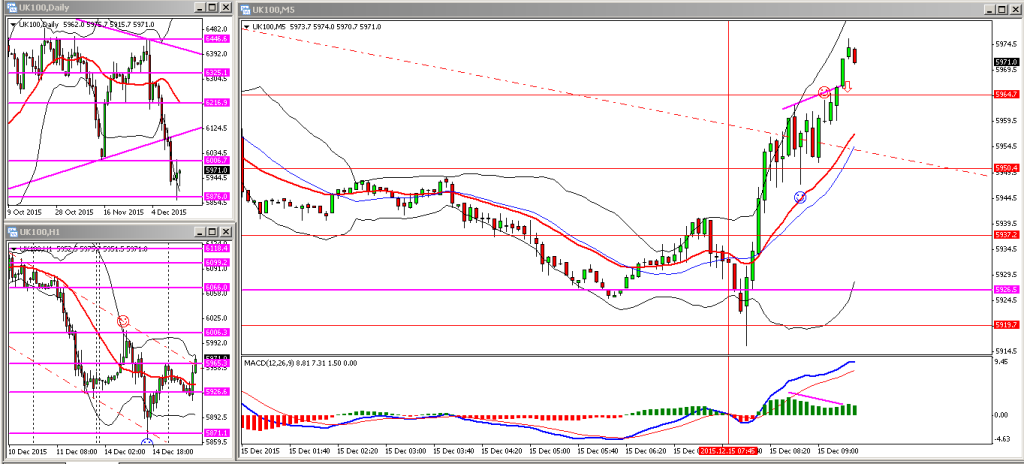
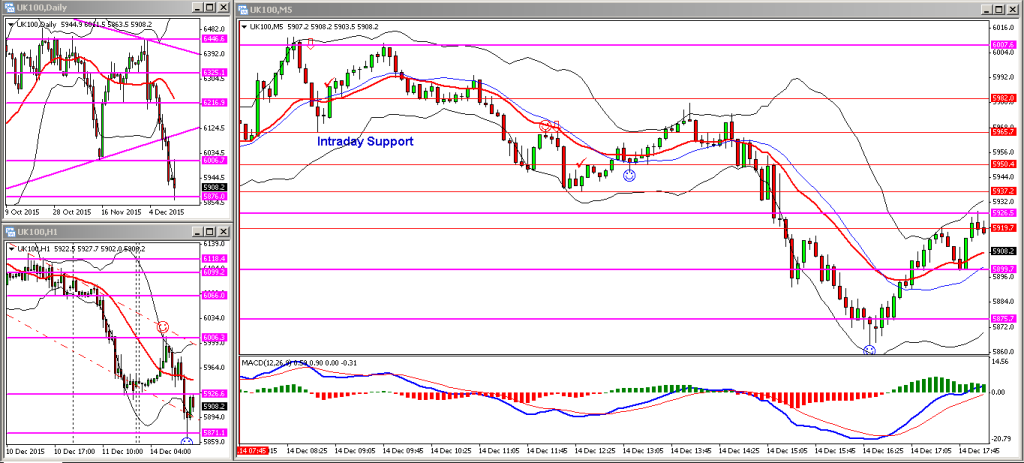
- There was a sell off after hours yesterday followed by a good recovery overnight so I was expecting some continuation this morning.
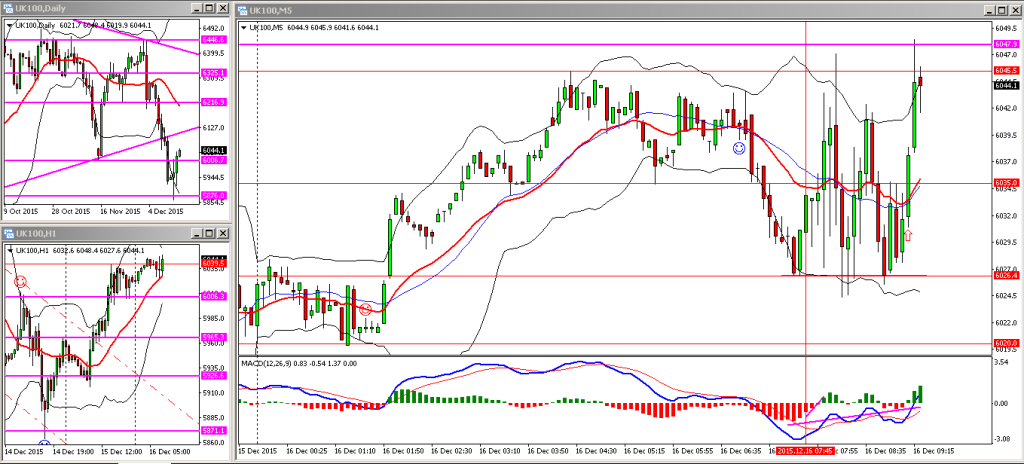
The open was a little messy with several long candles as you can see on the 5 minute chart, and the FTSE oscillating between the levels of support and resistance between the 6026 and the 6045 levels respectively.
In addition to the triple bottom formation, I also noticed a class-B divergence between price and the MACD histogram bars so I’ve taken a long @ 6030 with a 20 pip stop which I’ve already trailed in.


