Category Archive : End of Day

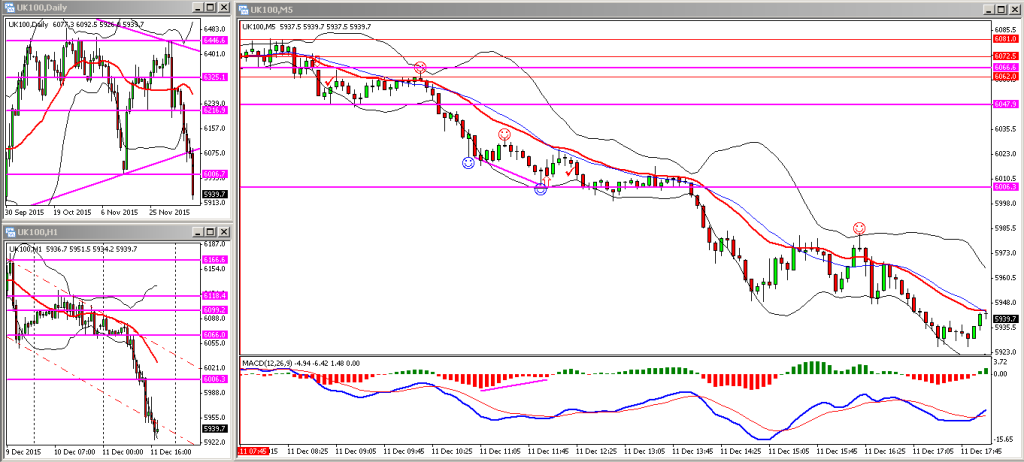
Friday 11th December 2015 – Afternoon

Unfortunately I was out this afternoon and missed the carnage during the US session. Only one other trade to report which was taken based on a class-A divergence pattern on the MACD histogram. It was a counter-trend scalp and I was quick to grab a few points before lunch. Popped out for a rather long lunch and when I got back I was really surprised to see that the FTSE 100 had crashed through the 6000 level as it had.

FTSE 11122015 PM


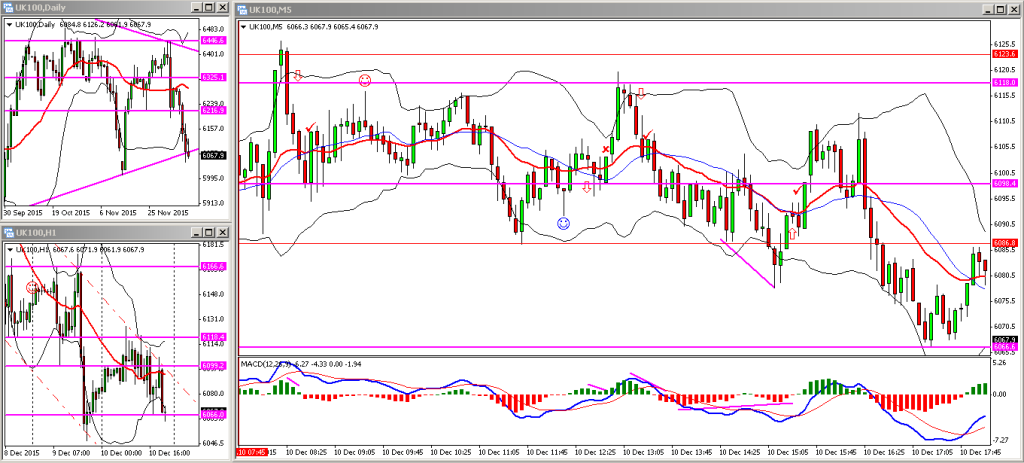
Thursday 10th December 2015 – Afternoon

The FTSE spent most of the day range bound between the 6118 and 6086 levels shown on my chart. I managed to get in a few more trades during the course of the afternoon, initially going short looking for the 6100 level to act as resistance (got stopped out), and later shorting the 6118 level again as the market popped back up to re-test it. Later this afternoon I changed directional bias and went long off a class-A MACD divergence pattern, and managed to scalp a few points closing out at the 6100 level.

FTSE 10122015 PM


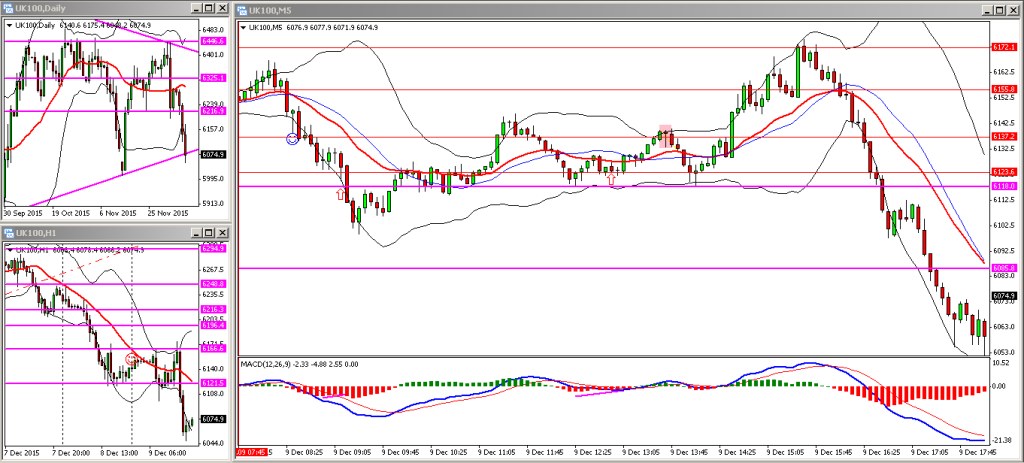
Wednesday 9th December – Afternoon

The FTSE behaved as expected for the early part of this afternoon as it slowly crept up and recovered this mornings fall in price. After 3:30 pm it was a different story as the market promptly declined and fell trough the lower trendline on the daily chart which I had mentioned in my previous post.

Unfortunately I got stopped out of this mornings trade (I was stopped out almost to the pip before the FTSE did a U-turn and headed back up), but managed to scalp back a few points with another long which I placed based on previous support and the MACD histogram indicating a potential change in momentum. I closed out after noticing a hanging man candlestick formation (highlighted in pink on the chart) as I wanted to clear the decks prior to the US session.

FTSE 09122015 PM


Tuesday 8th December – Afternoon

The FTSE behaved somewhat similar to yesterday in that it sold off from late morning onwards. Having missed out yesterday I was keen to get on the right side of the market and shorted the FTSE as it came back up to retest the previous support level at 6196. At the same time, the MACD histogram looked like it was starting to run out of steam and a doji candle had formed on the 5 minute chart. I closed out half the position at 6175 and left the remainder to run to 6165 (closed the position after the bullish pin-bar formed).
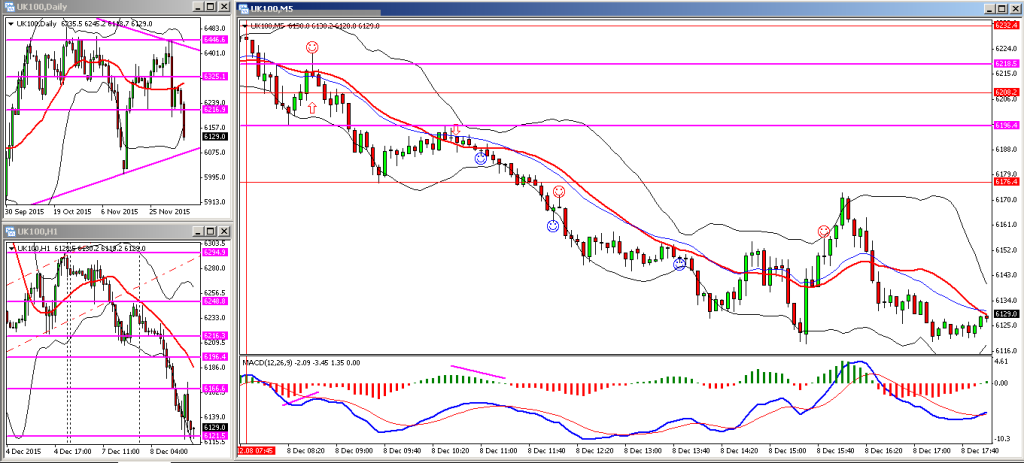
FTSE 08122015 PM

By the time the markets opened in the US the FTSE was heading back up and I didn’t manage to place any further trades – the FTSE did seem to be oversold at the time, especially on the hourly chart. There was also a lot of air on my charts and no clear support or resistance levels on the higher timeframes, so I decided to stay out of the market for the rest of the afternoon.