Category Archive : FTSE Analysis

Friday 11th December 2015 – Morning

Key points to note going into this mornings session:

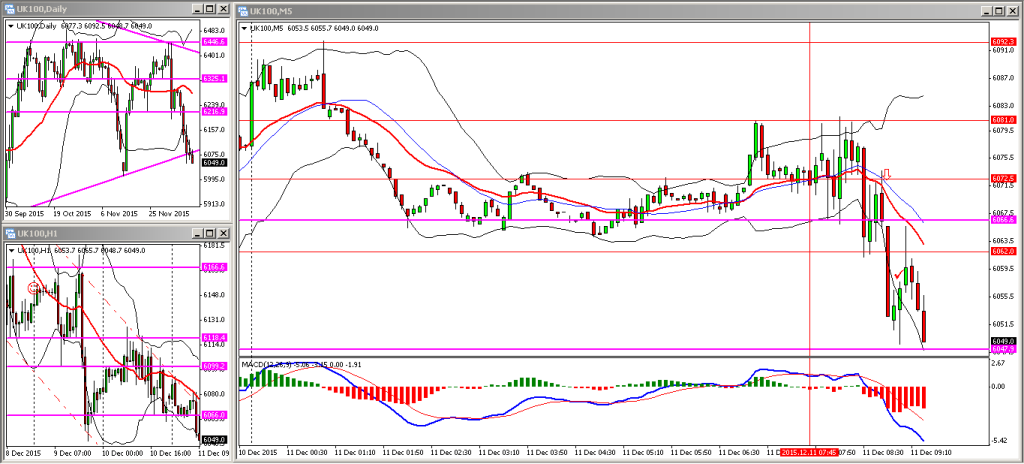
  • On the daily chart the FTSE had broken through the lower trendline indicating a clear break in structure
  • On the hourly chart the FTSE was at the top of the downward sloping channel

Given the factors above I was keen to short any pullbacks this morning…

I went short at the overnight resistance level of 6072 which also coincided with a pullback to the 20EMA, trailed my stop as the market fell, then got stopped out as it pushed up. Points in the bank and a good trade to reflect on; may not trade at all for the rest of the day unless I see a cracking setup present itself.

FTSE 11122015 AM

Thursday 10th December 2015 – Afternoon

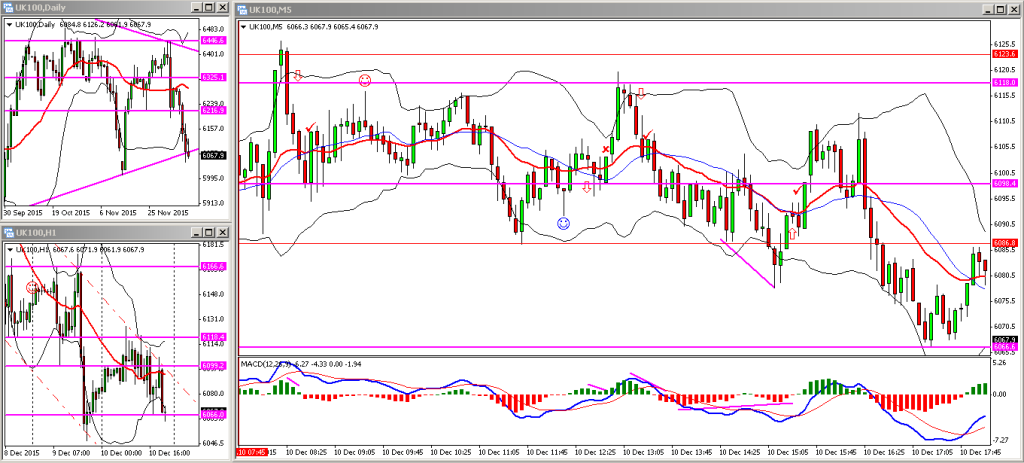
The FTSE spent most of the day range bound between the 6118 and 6086 levels shown on my chart. I managed to get in a few more trades during the course of the afternoon, initially going short looking for the 6100 level to act as resistance (got stopped out), and later shorting the 6118 level again as the market popped back up to re-test it. Later this afternoon I changed directional bias and went long off a class-A MACD divergence pattern, and managed to scalp a few points closing out at the 6100 level.

FTSE 10122015 PM


Thursday 10th December 2015 – Morning

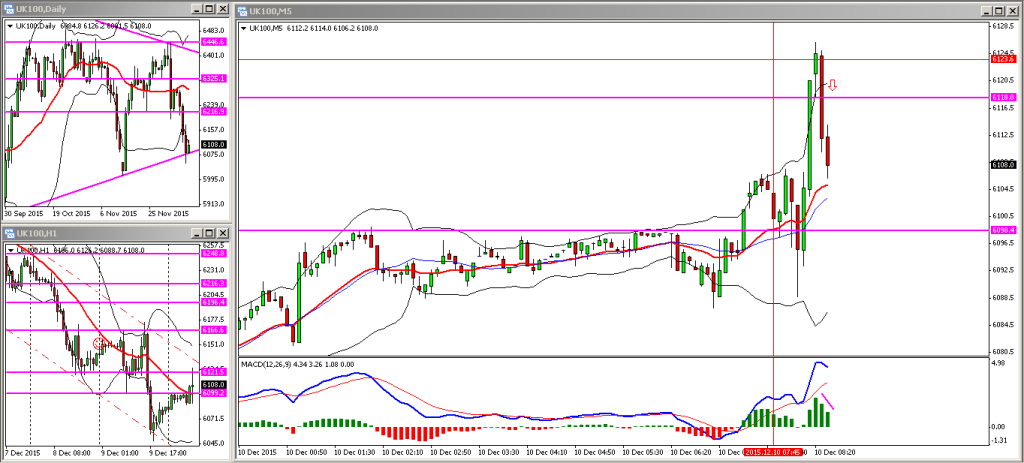
On the daily chart it looked like price had just come off that lower trendline, however, the FTSE has been trading in a downward sloping channel on the hourly chart so I was looking to get short this morning off any pullbacks to key levels.

Shots fired and I’ve done exactly that getting in at the 6118 level, a previous level of support which hopefully will act as resistance in this case. Further confirmation before placing the trade was that the MACD histogram bars were beginning to decline and price was starting to head back down.

FTSE 10122015 AM


Wednesday 9th December – Afternoon

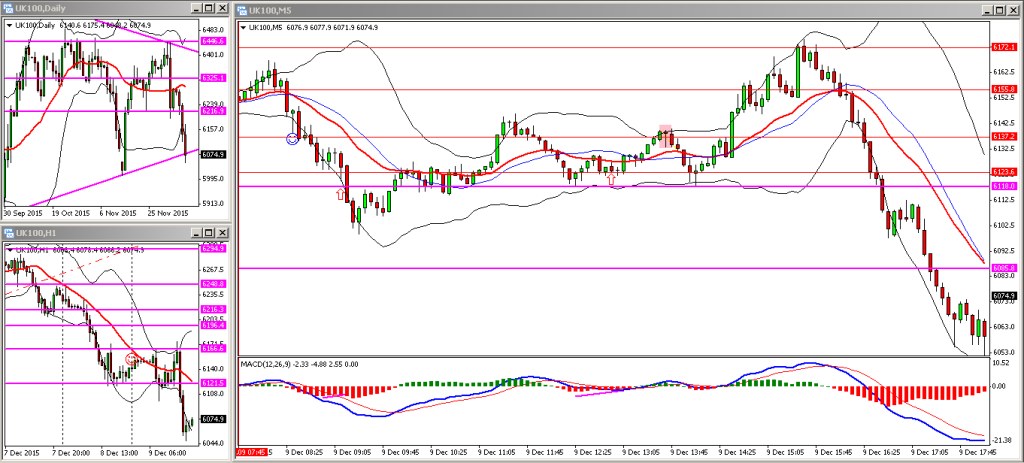
The FTSE behaved as expected for the early part of this afternoon as it slowly crept up and recovered this mornings fall in price. After 3:30 pm it was a different story as the market promptly declined and fell trough the lower trendline on the daily chart which I had mentioned in my previous post.

Unfortunately I got stopped out of this mornings trade (I was stopped out almost to the pip before the FTSE did a U-turn and headed back up), but managed to scalp back a few points with another long which I placed based on previous support and the MACD histogram indicating a potential change in momentum. I closed out after noticing a hanging man candlestick formation (highlighted in pink on the chart) as I wanted to clear the decks prior to the US session.

FTSE 09122015 PM