Category Archive : FTSE Analysis

Wednesday 9th December – Morning

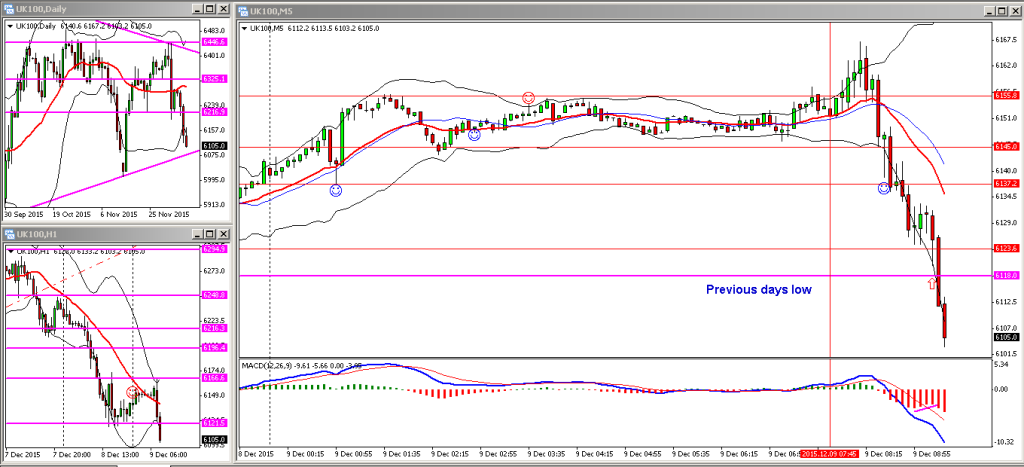
My thoughts going into this morning are as follows:

  • Overnight the FTSE has been trading in a relatively narrow range between 6145 and 6155.
  • The last two days have seen the market rally up and continue to sell off for the best part of the day, then recover during the US session, or after market hours.
  • On the daily chart the market is not far off the upward sloping trendline, a triangle pattern formation; so beware of a pullback off that trendline.

Although I was planning to short the market on any significant pullbacks, I was slow off the mark as the market seemed to sell off straight from the open, and I was unable to get on-board as intended.

I have just taken a speculative long off the yesterdays low of the day (LOD) at 6118 (MACD histogram bars seemed to be declining) and looks like I’m going to get stopped out.

FTSE 09122015 AM

Note to self … Learn to trade with the trend you fool! Don’t try to catch falling knives!

Tuesday 8th December – Afternoon

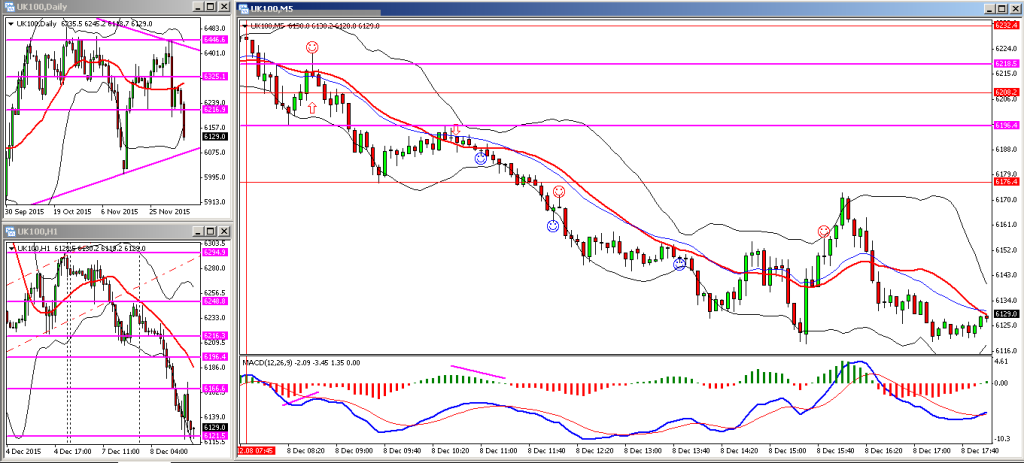
The FTSE behaved somewhat similar to yesterday in that it sold off from late morning onwards. Having missed out yesterday I was keen to get on the right side of the market and shorted the FTSE as it came back up to retest the previous support level at 6196. At the same time, the MACD histogram looked like it was starting to run out of steam and a doji candle had formed on the 5 minute chart. I closed out half the position at 6175 and left the remainder to run to 6165 (closed the position after the bullish pin-bar formed).

FTSE 08122015 PM

By the time the markets opened in the US the FTSE was heading back up and I didn’t manage to place any further trades – the FTSE did seem to be oversold at the time, especially on the hourly chart. There was also a lot of air on my charts and no clear support or resistance levels on the higher timeframes, so I decided to stay out of the market for the rest of the afternoon.

Tuesday 8th December – Morning

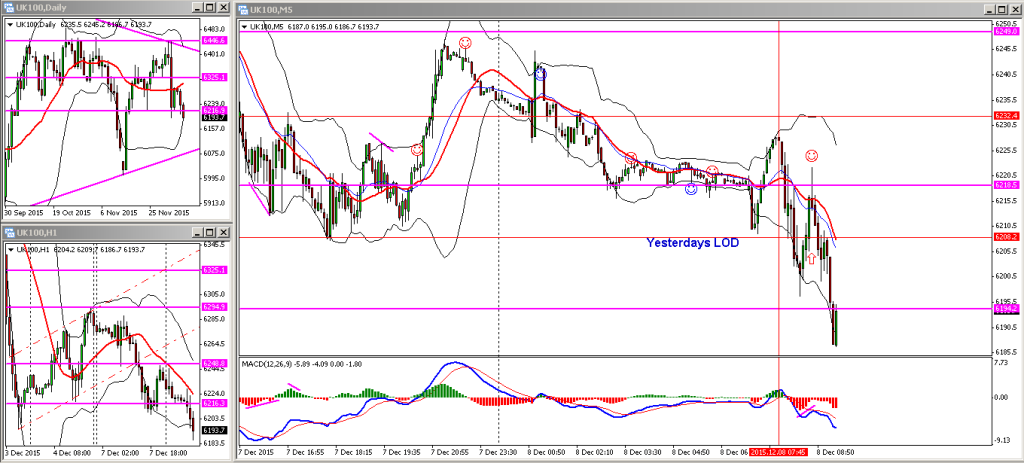
The FTSE had sold off steadily overnight at the open I was hoping to get short off any bounce up to any previous levels of support and resistance. However, ended up taking a speculative long as the FTSE came off the lower Bollinger band with the MACD histogram bars rising indicating a change in momentum. Managed to scalp a few points off that trade.

The market has since reversed off the overnight support level at 6218, creating a classic pin-bar on the 5 minute chart, and proceeded to fall through yesterdays lows of 6208, as well as the 6200 level.

FTSE 08122015 AM

Monday 7th December – Afternoon

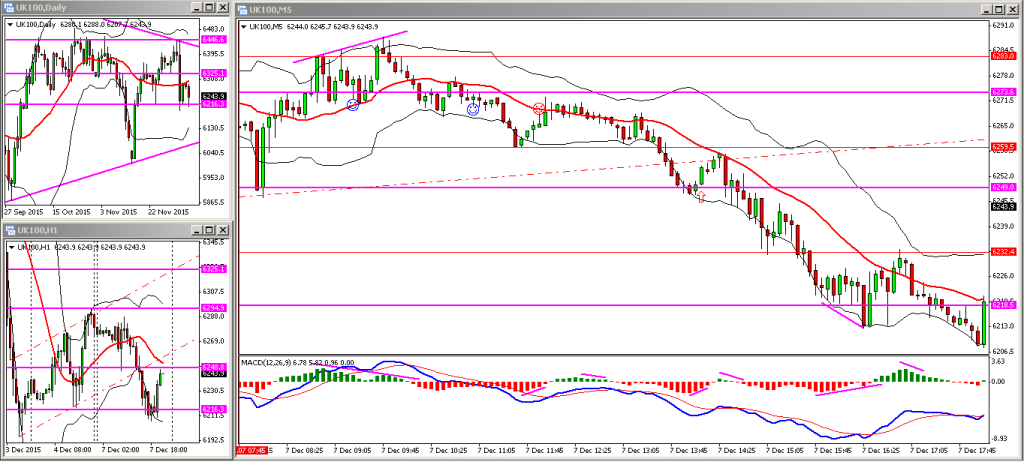
Quick round up of todays action with the help of the updated chart below. The FTSE traded within the range anticipated for most of the morning, then sold off in the afternoon and broke though the support level at 6249. I took a small long as price hit the support level and managed to scalp a few points.

FTSE 07122015 PM

In hindsight I should have traded off the MACD divergence signal and switched my bias – apart from the early rise this morning the market has been trading under the 20 SMA (simple moving average) and I would have done better getting short this afternoon.

On the daily and hourly charts the break in market structure is quite clear, so I’m expecting further weakness for the rest of the week.